
In most cases a blue screen is caused by hardware or driver failure. In this article I show how to find out the cause of the blue screen by using the tool WinDbg.
The Dump File
A dump file is a snapshot. It contains information about the current state of your system. It is often generated when a process is about to crash. The default storage location of dump files can be changed by pressing the keys Windows + PAUSE/Break. Then click on Advanced System Settings. In section Startup and Recovery click Settings.

Reading a dump file can be frustrating. See the following dump ;-). And now tell me what this means.

Make it readable with WinDbg
First, you have to download the Debugging Tools:
https://developer.microsoft.com/en-us/windows/hardware/download-windbg
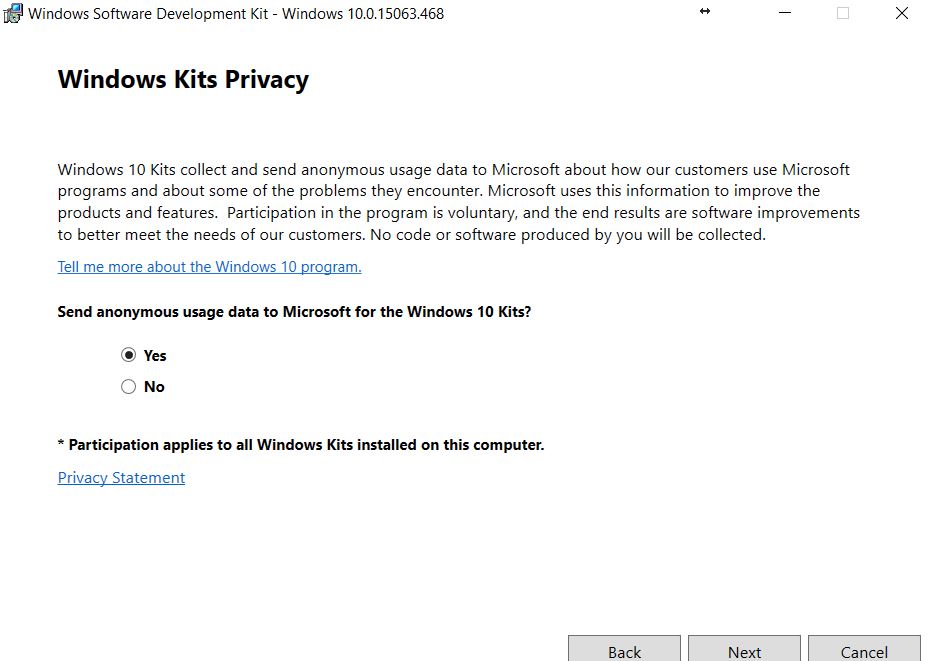
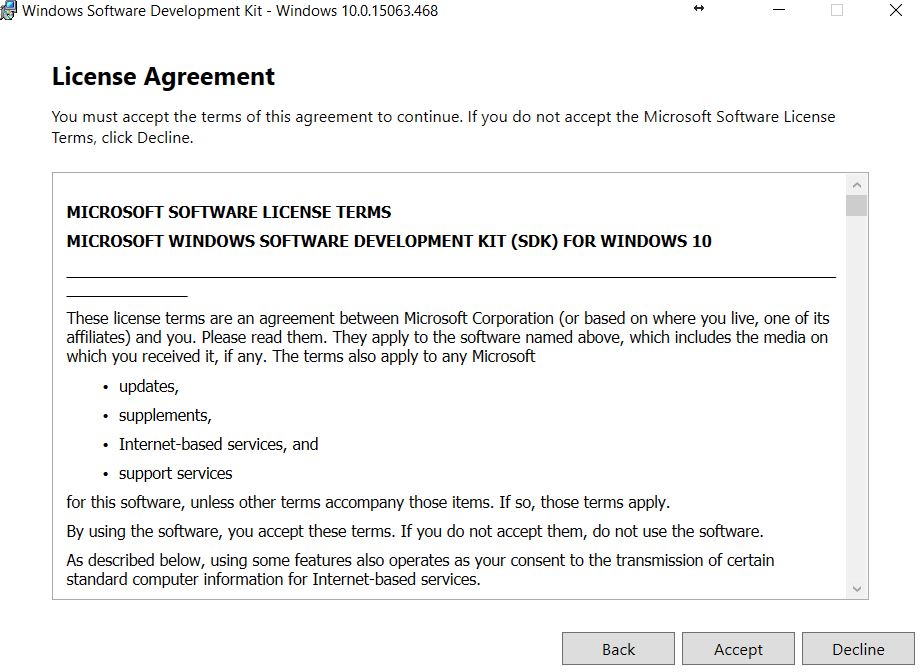
Next, we have to install it.


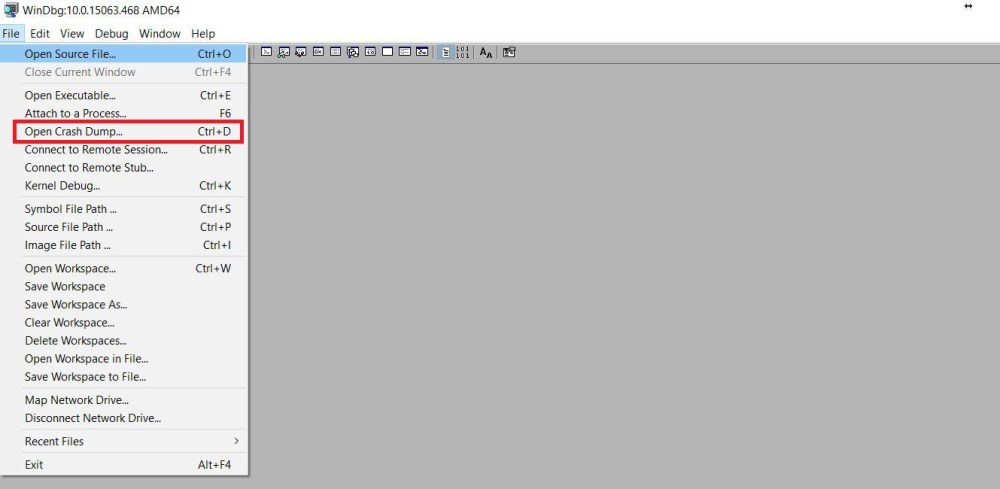
Opening the Crash Dump
Start Windbg. Click on File and select Open Crash Dump …
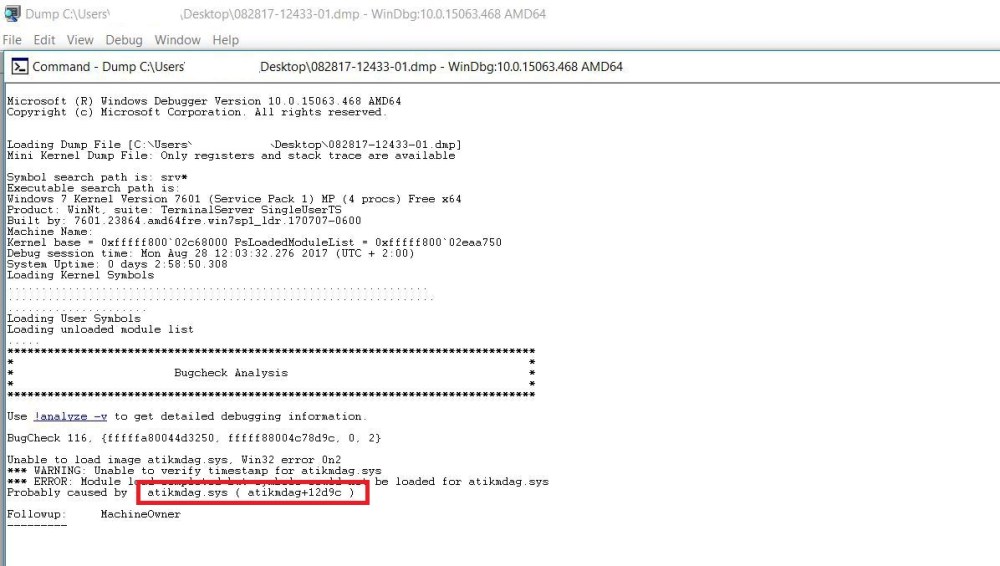
Navigate to your Crash Dump folder and open the file. In the follwing example, I found out that the ATI driver of the graphic card was causing the blue screen.
I wish you all the best finding out the cause of your blue screen.
Categories: Windows 10, Windows Server


Thanks for your work. This function is nice and easy to use.
Your function is very helpful and we can see all the system configurations in one look.
LikeLiked by 1 person